

We built a small test table that four Databricks SQL alerts should have caught, and three of them stayed OK. The fourth ended in an error instead of firing. An alert runs a query on a schedule and notifies people when the result meets a condition, and on a healthy copy of the table all four showed OK.
At TechFabric, we'd test an alert the way we test a data quality rule, by giving it an input that must trip it. An alert that has never fired may be watching a healthy system or may be unable to fire at all, and its history looks the same either way. Sushruth's post on freshness, volume and schema checks keeps every pass because a stored pass "tells a quiet month from a broken monitor". An alert that can't fire passes too.
We ran this in Databricks Free Edition on November 15, 2026, with synthetic orders. Counting the original and corrected alerts on two copies of the data, plus six single-query probes, that came to 22 alerts, each evaluated on demand by a one-time job.
How an alert reads its query
The condition checks one value from the result, usually against a threshold. Without an aggregation such as a sum, the alert API reference says "the value in the first row is used, which is equivalent to using First row in the UI". Each evaluation then ends as OK, TRIGGERED or ERROR, the three states in the alerts overview. Two kinds of missing data ended in ERROR in our probes. A query that returned no rows did when the alert read its first row, because the alert's Empty result state defaults to Error. So did a NULL, SQL's marker for a missing value, compared with a number, while the "is null" operator triggered on it.
A test table built to trip four alerts
We borrowed the setup from our kill matrix for data quality rules. The healthy copy of an orders table holds six November 14 orders, all shipped within 40 hours and all with amounts. The test copy moves them to November 13, gives one Chicago order a 72-hour shipping time and adds a Boston order with no amount. Nothing in it falls on November 14, the day the revenue alert reports on. An order counts as late when it takes more than 48 hours to ship, and each of the eight alerts ran against both copies with only the schema name changed in its query.
| Alert as first written | Test copy | Corrected alert | Test copy |
|---|---|---|---|
| Late orders per store, first row above 0 | OK | Sum of late orders above 0 | TRIGGERED |
| Share of orders with an amount below 0.99, read from a cleaned view | OK | Same check on the raw table: 6 of 7, or 0.857 | TRIGGERED |
| Share of late orders above 5 | OK | Share of late orders above 0.05: 1 of 7, or 0.143 | TRIGGERED |
| Revenue for November 14 below 500 | ERROR | Missing revenue counted as 0 | TRIGGERED |
All eight alerts showed OK on the healthy copy, so on a normal day a broken alert and its fix look the same.
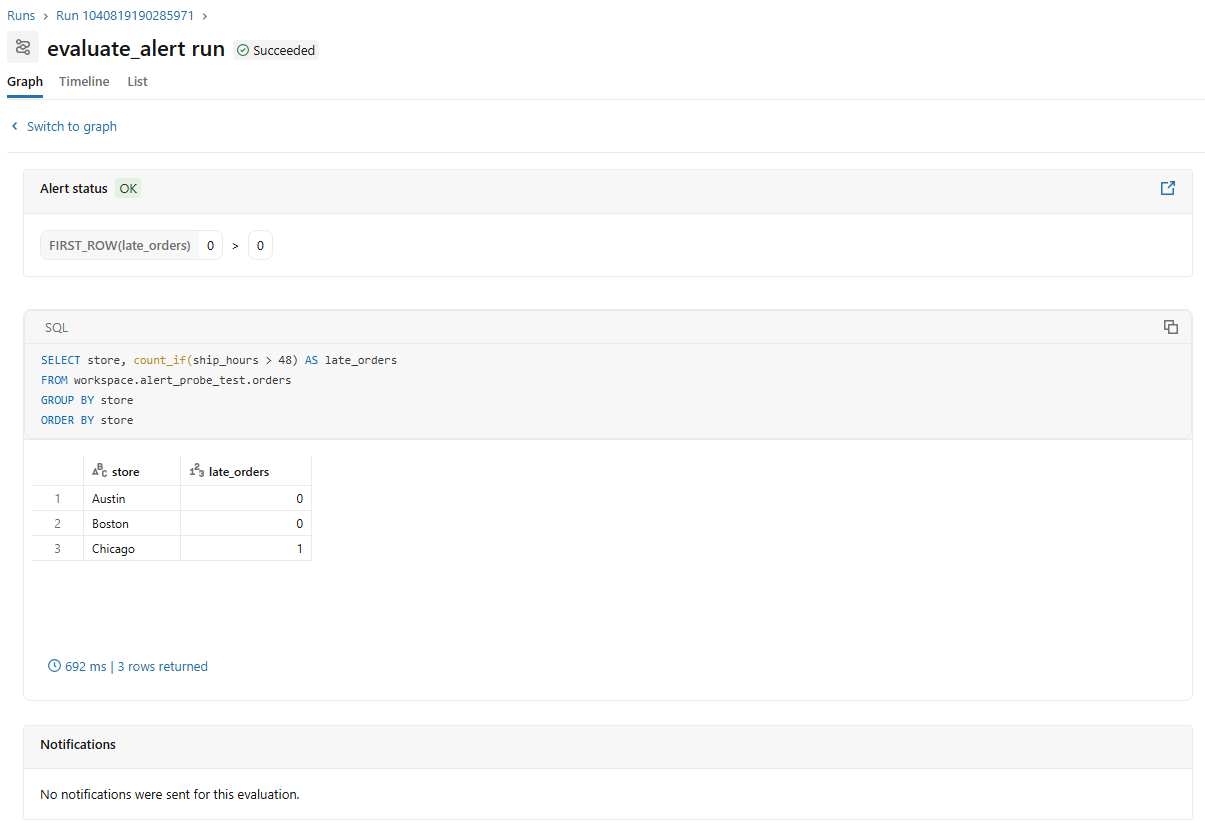
The late-orders query returns one row per store, sorted by name. Austin comes first with no late orders, so the alert compared Austin's zero with the threshold and never looked at Chicago. Summing all rows made it fire.
SELECT store, count_if(ship_hours > 48) AS late_orders
FROM workspace.alert_probe_live.orders
GROUP BY store
ORDER BY store
The completeness alert read a cleaned view, a saved query that drops orders without an amount, so its ratio of orders with an amount to all orders stays at 1.0 whenever the view has rows, and it can't trigger. The late-share alert compared a fraction between 0 and 1 with a threshold of 5, as if the share were a percentage.
The revenue alert summed amounts for November 14. With no orders that day the sum was NULL and the evaluation ended in ERROR. When we gave this alert a subscriber and ran it again, the email said it "was ERROR" with "Incompatible type in alert evaluation OR the empty result state is set to ERROR", which reads like a broken alert rather than missing revenue. A missing day is what we'd want a revenue alert to catch, so the corrected query counts missing revenue as zero.
SELECT coalesce(sum(amount), 0) AS revenue
FROM workspace.alert_probe_live.orders
WHERE order_date = DATE'2026-11-14'
What a green job run tells you
We ran each alert through a SQL alert task, the job step that evaluates one alert, as a pipeline would after a load. Tasks finished as Succeeded whether their alert ended OK or TRIGGERED, which the SQL alert task page documents: "regardless of whether the alert condition was triggered or not". Every evaluation that ended in ERROR failed its task.
So we read the alert status from each run, and the notifications where the alert had a subscriber. The summed late-orders alert showed TRIGGERED with a value of 1, and the email that reached its one subscriber said it "was TRIGGERED". The alert's own page didn't show any of this. Nearly an hour after the job runs, it still said "No runs yet" and "Not Run".
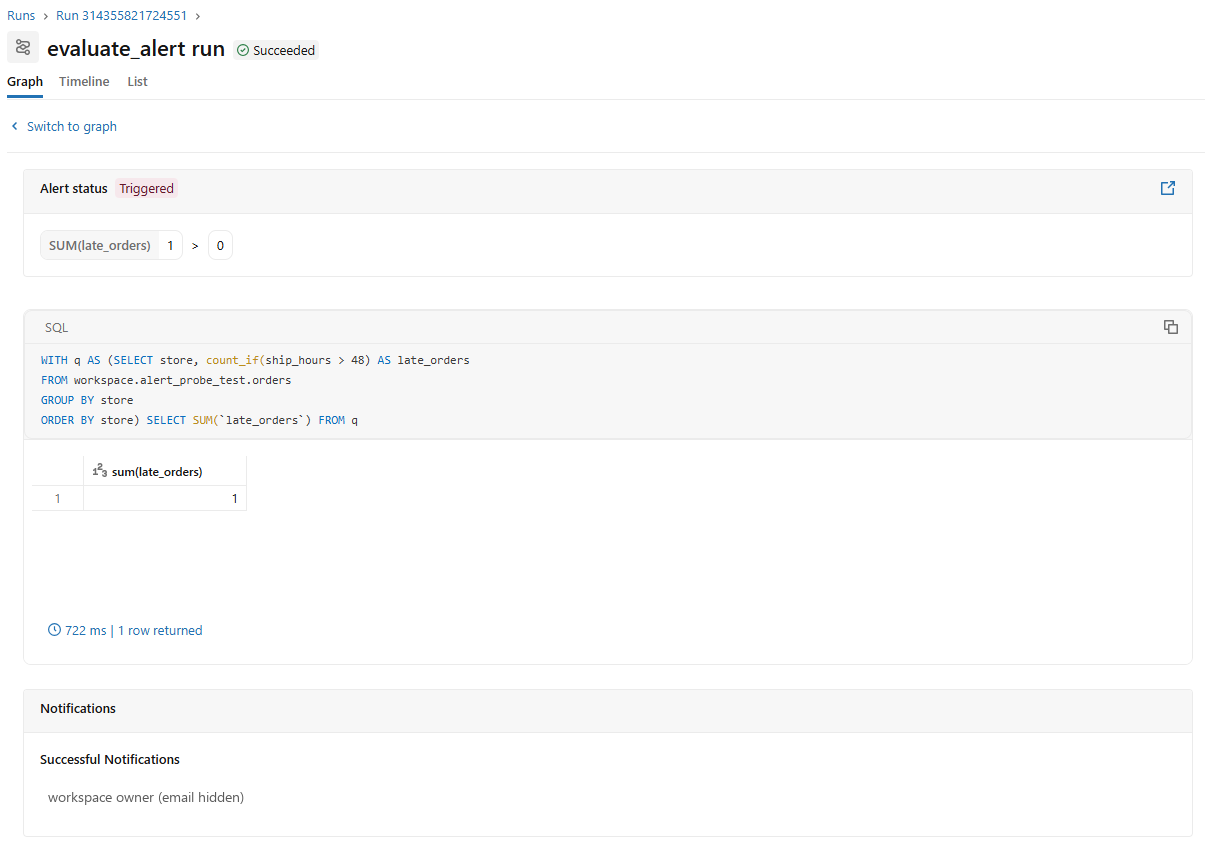
That gives each alert a repeatable test. We plant rows the alert must catch, run the alert task on the test copy and check that the alert status is TRIGGERED. If it's OK or ERROR, we fix the query, aggregation, threshold or empty-result setting and run it again. If it triggered, we check the notification arrived.
Checking the alerts already in production
The alert system tables log every evaluation with its state, the value the alert read and the threshold. We'd list the alerts that haven't triggered in 90 days and give a test input first to those whose value never came near the threshold or never changed.
SELECT workspace_id, alert_id,
       count(*) AS evaluations,
       min(evaluated_source_result.double_value) AS lowest_value,
       max(evaluated_source_result.double_value) AS highest_value,
       max(evaluated_threshold_result.double_value) AS threshold,
       count_if(evaluated_state = 'ERROR') AS errors
FROM system.alert.alert_evaluation_history
WHERE start_time >= current_timestamp() - INTERVAL 90 DAYS
GROUP BY workspace_id, alert_id
HAVING count_if(evaluated_state = 'TRIGGERED') = 0
ORDER BY evaluations DESC;
We haven't run this query, because the alert system tables weren't available in our Free Edition workspace. By default, only users who are both account admin and metastore admin can read them.
We'd start with the alerts people rely on most and write down the rows that must trip each one. We'd keep the healthy copy next to the test copy, because in our run it showed that none of the four fixes fired on good data.
Frequently asked questions
Why not use Test condition when creating an alert?
The alert setup guide says to click Test condition "to preview the alert and test whether the alert would trigger with the current data". All eight of our alerts showed OK on the healthy copy, so a check against good data couldn't tell the broken ones from their fixes. A test copy with known faults gives the same answer every time.
Should the empty result state be OK?
When the query lists bad rows, an empty result is the healthy case, and setting it to OK gave OK in our probe. When the query should always return a number, we'd leave ERROR in place and evaluate the alert in a job, where an ERROR fails the task.
Can a SQL alert task stop the next task in a job?
Not when the alert triggers. The task reports Succeeded either way, so with the default dependency settings the next task still runs. To hold back data we'd use a check that fails, as in our post on data quality gates.