

OEE, overall equipment effectiveness, is the share of planned production time that turned into good parts at full speed, and the same shift records can give different OEE figures. When a dashboard and a Genie answer make different choices about changeovers or about which day a night shift belongs to, the plant manager gets two figures for the same week and can't tell which one to act on.
At TechFabric, we'd define OEE once in a Databricks metric view and test it on shifts with known answers before any dashboard or Genie reads it. A metric view stores that definition and computes it for whichever line, shift or day a query asks about, so a dashboard and Genie start from the same one. In our leadership reporting for a new plant, dashboards and Genie read the same finished tables, which hold one definition per metric.
We built this example in Databricks Free Edition from 54 synthetic shifts on two lines over nine days, and didn't build a dashboard, a Genie space or a scheduled job on top of it. Our daily test flagged five of the seven alternative OEE definitions we tried. The other two passed it and went wrong when we grouped the results another way, such as by shift.
Four decisions inside an OEE number
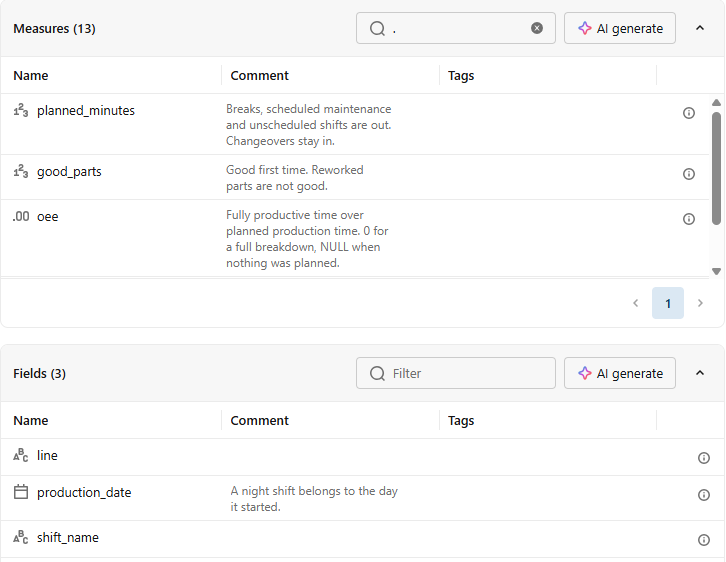
We took the standard definition from Vorne's OEE reference, where OEE multiplies how much of the planned time the line ran (availability), how close it came to its ideal speed (performance) and how many of its parts were good (quality). The formulas still leave the plant four decisions, and we wrote each as a comment on its measure or field, which Catalog Explorer lists beside the name.
- We take breaks and shifts with no orders out of planned production time, as Vorne does, because nobody meant the line to run then. We also take out scheduled maintenance, which Vorne's Six Big Losses page counts as a planned stop. That one choice moves line 1 on November 5 from 61.3% to 78.9%, so we'd agree it with the plant first. Changeovers stay in and count against availability, as on Vorne's OEE factors page, because that time could have made parts.
- We give a night shift from 22:00 to 06:00 to the day it started, so each shift lands on one date.
- We count reworked parts against quality, because a part is good only if it passed first time.
- We score a shift that was planned but never ran at 0%, and leave a shift with nothing planned blank, because it had no planned time to lose.
Our control shift ran on a line whose ideal speed is one part every 2 seconds. In its 480 minutes it had 30 minutes of breaks, a 20-minute changeover and 25 minutes of stops, and made 11,000 parts, 100 of them scrap. That leaves 450 minutes of planned production time and 405 minutes of run time. At 2 seconds each, the 11,000 parts would have taken 366.7 minutes, the net run time, and the 10,900 good parts 363.3 minutes, the fully productive time. OEE is 363.3 divided by 450, or 80.7%.
Test shifts with answers worked out first
The other test shifts cover five hours of scheduled maintenance, a whole-shift breakdown, a night with nothing planned, 400 reworked parts, a night shift across midnight and a three-hour breakdown on the last day. We worked out the expected answers with a Python script in exact fractions and saved them before the metric view existed.
CREATE OR REPLACE VIEW workspace.oee_probe.oee_metrics WITH METRICS LANGUAGE YAML AS
$$
version: 1.1
source: workspace.oee_probe.shift_production
fields:
  - name: line
    expr: line_id
  - name: production_date
    expr: DATE(shift_start)
    comment: "A night shift belongs to the day it started."
  - name: shift_name
    expr: shift_name
measures:
  - name: planned_minutes
    expr: SUM(shift_minutes - planned_downtime_minutes)
    comment: "Breaks, scheduled maintenance and unscheduled shifts are out. Changeovers stay in."
  - name: run_minutes
    expr: SUM(shift_minutes - planned_downtime_minutes - changeover_minutes - unplanned_stop_minutes)
  - name: parts_made
    expr: SUM(total_count)
  - name: good_parts
    expr: SUM(total_count - scrap_count - rework_count)
    comment: "Good first time. Reworked parts are not good."
  - name: ideal_seconds_made
    expr: SUM(ideal_cycle_seconds * total_count)
  - name: ideal_seconds_good
    expr: SUM(ideal_cycle_seconds * (total_count - scrap_count - rework_count))
  - name: availability
    expr: try_divide(MEASURE(run_minutes), MEASURE(planned_minutes))
  - name: performance
    expr: try_divide(MEASURE(ideal_seconds_made), MEASURE(run_minutes) * 60)
  - name: quality
    expr: try_divide(MEASURE(good_parts), MEASURE(parts_made))
  - name: oee
    expr: try_divide(MEASURE(ideal_seconds_good), MEASURE(planned_minutes) * 60)
    comment: "Fully productive time over planned production time. 0 for a full breakdown, NULL when nothing was planned."
  - name: ideal_seconds_good_7d
    expr: SUM(ideal_cycle_seconds * (total_count - scrap_count - rework_count))
    window:
      - order: production_date
        range: trailing 7 day inclusive
  - name: planned_minutes_7d
    expr: SUM(shift_minutes - planned_downtime_minutes)
    window:
      - order: production_date
        range: trailing 7 day inclusive
  - name: oee_7d
    expr: try_divide(MEASURE(ideal_seconds_good_7d), MEASURE(planned_minutes_7d) * 60)
    comment: "The 7 production days ending with the day shown, that day included."
$$
The test returns each line and day where OEE or rolling OEE differs from the expected answer, so an empty result is a pass.
WITH actual AS (
  SELECT line, production_date, MEASURE(oee) AS oee, MEASURE(oee_7d) AS oee_7d
  FROM workspace.oee_probe.oee_metrics
  GROUP BY ALL
)
SELECT coalesce(e.line, a.line) AS line,
       coalesce(e.production_date, a.production_date) AS production_date,
       e.oee AS expected_oee, a.oee AS actual_oee,
       e.oee_7d AS expected_oee_7d, a.oee_7d AS actual_oee_7d
FROM workspace.oee_probe.expected_daily_oee AS e
FULL OUTER JOIN actual AS a
  ON a.line = e.line AND a.production_date = e.production_date
WHERE NOT coalesce(abs(a.oee - e.oee) < 1e-9, a.oee IS NULL AND e.oee IS NULL)
   OR NOT coalesce(abs(a.oee_7d - e.oee_7d) < 1e-9, a.oee_7d IS NULL AND e.oee_7d IS NULL)
It returned no rows, and all 336 values our Python script compared across five groupings, from single shifts to the whole plant, matched.
What the alternative definitions did
To check that the test can fail, we added measures and one date field to a second metric view, each making one decision of the contract, our agreed definition, the other way. We compared each one with the expected answer for each line on each of the nine days, 18 answers in all. One of them averages the shifts' ratios, as the weekly rate averaged daily rates in our post on Gold tables ready for business, and here it gave the maintenance shift's 150 planned minutes the same weight as the 450 of a full shift.
| Decision made the other way | Contract | Alternative | Line and day results flagged |
|---|---|---|---|
| Line OEE as the average of its shifts, line 1, Nov 5 | 78.9% | 70.9% | 1 of 18 |
| Reworked parts counted as good, line 1, Nov 6 | 80.5% | 81.5% | 1 of 18 |
| Changeovers as planned downtime, line 1, Nov 5 | 78.9% | 81.2% | 18 of 18 |
| Night shift dated when its record was written (06:05 next day), line 1, Nov 4 | 82.1% | 79.5% | 18 of 18, plus a Nov 11 for each line |
| Rolling 7-day OEE with the default range, line 1, Nov 10 | 79.9% | 81.6% | 18 of 18 |
Two more alternatives passed the daily test and broke when grouped by shift. The first wrote OEE as the product of its three factors. On the evening when line 2 stood still all shift, performance and quality had nothing to divide by, so the product came back blank where the contract showed 0%. Grouped across both lines, it also drifted from the contract's OEE by up to 0.1 points, because the two lines have different ideal speeds.
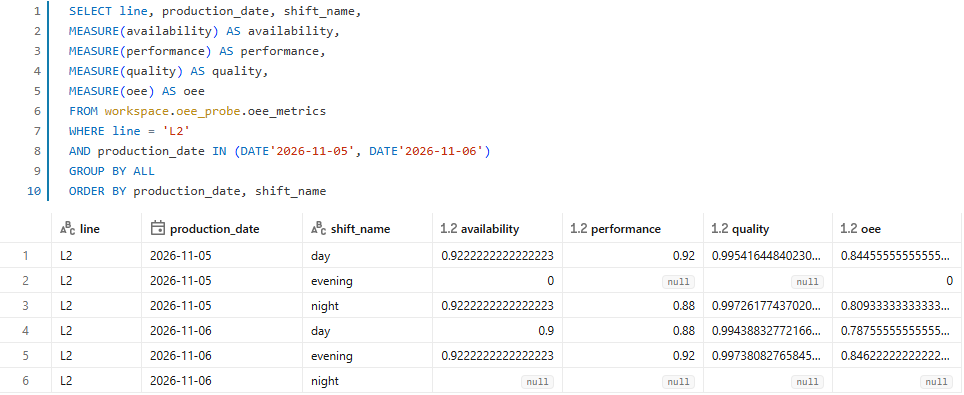
The second used plain division in the OEE ratio. With ANSI mode on, the stricter SQL setting our warehouse ran with, our query grouped by shift failed with a divide-by-zero error, as the division operator reference says it will, because the night with nothing planned has no planned time. By line, the same measure returned 80.5% and 79.0%, so a line-level test would have passed it. We'd keep the contract's division, which returns an empty value for a zero divisor, and test at the most detailed level a dashboard shows.
The day rolling OEE leaves out
A rolling 7-day OEE in a metric view leaves out the day it's shown for, unless the definition says otherwise. The YAML reference says so for a trailing range, and the inclusive keyword that changes it requires Databricks Runtime 18.1 and YAML specification 1.1. It worked on our Free Edition warehouse, Databricks SQL version 2026.44.
On November 10, a three-hour breakdown cut line 1's OEE for the day to 70.5% and its inclusive rolling OEE to 79.9%. The default range read 81.6%, the inclusive figure for November 9, because it left November 10 out.
Filtered to November 9 and 10, the rolling values matched the unfiltered query because the window still read the six days before each date. The Databricks SQL release notes for 2026 list a fix in version 2026.20 for window measures under GROUP BY, IN and BETWEEN filters, so we'd keep a filtered query in the test.
We'd start with the plant's own OEE definition and its four decisions, agreed with production. Then we'd work out OEE with the people who own the number for a dozen real shifts, including a breakdown, a maintenance shift, rework and a night shift, and rerun the comparison after every change to the view, as part of how we'd set up AI/BI dashboards and Genie for a manufacturer.
Frequently asked questions
Why test the metric view itself?
Dashboards, Genie and SQL queries that read the view all start from its definition, so a test there checks the number at its source. It doesn't replace checking Genie's answers. In Oleksandr's Genie benchmark post, Genie's built-in benchmark still scored a changed metric Good, and one agent instruction overrode what the metric view said revenue meant.
Should a breakdown show 0% or blank?
We'd show 0%, because production was planned and none of it happened, and that loss belongs in the line's OEE. Blank is for shifts with nothing planned, such as a night without orders.
Can the test run on a schedule?
We'd run the comparison before the dashboard refresh, as a job step that raises an error when the comparison returns rows. Our post on a release gate for data quality shows how we'd hold back data when a check fails.