

Enabling Genie One's tracing preview did not configure a trace destination in our workspace. We read the preview flag back as enabled, while the unified configuration still reported tracing disabled with no catalog or schema. We restored the flag.
To examine the answers while native export remained unconfigured, we ran five synthetic requests and compared their public responses with SQL query history. We matched successful queries using unique SQL comments; for a deliberately invalid query, we used its exact text and the request's time window. The query failed. Genie completed a response that correctly explained the missing-column error.
The arithmetic control ran before the preview probe. The other four requests ran after we restored the flag.
Databricks released Genie Code and Genie One tracing in Beta on 5 November 2026. Our run establishes a response-and-query baseline for a future tracing trial; it collected no native Genie traces.
A failed query inside a completed response
We asked Genie One to attempt this query exactly as written, explain any error and leave it unrepaired:
SELECT missing_amount FROM VALUES (100) AS synthetic(amount)
Because the query asks for a column absent from the inline data, query history recorded an unresolved-column error and suggested the available column, which Genie's final explanation also identified.
We kept the response outcome and the SQL outcome together:
| Evidence | Observed value |
|---|---|
| Public response lifecycle | completed |
| SQL query status | FAILED |
| SQLSTATE | 42703 |
| SQL error | UNRESOLVED_COLUMN.WITH_SUGGESTION |
| Final explanation | The requested column doesn't exist; the available column is amount |
| Correlation | Exact query text within the request observation window, same user and warehouse |
Genie attempted the invalid query and explained the failure, as the prompt requested.
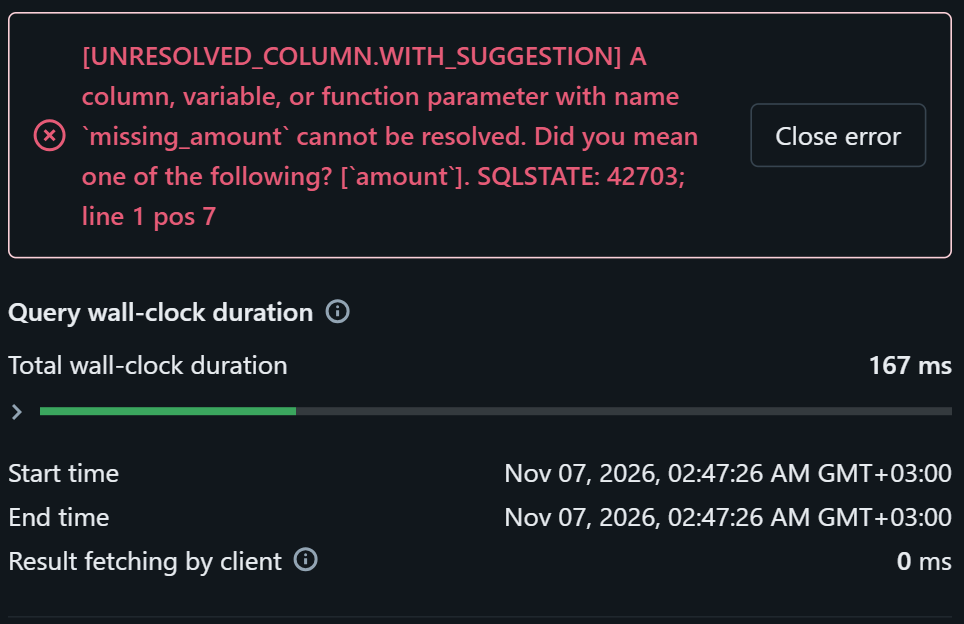
The response API returns a lifecycle status and public assistant messages. We think a review workflow should retain the SQL outcome alongside the response status, because in our deliberate error case Genie completed its explanation of a query that failed. We'd retain both identifiers so another reviewer can reopen the evidence.
The four-row finance fixture
We used the following invented revenue values to make the calculations independently checkable. They contain no client data and describe no actual business.
| Region | January revenue | February revenue |
|---|---|---|
| A | 100 | 120 |
| B | 80 | 80 |
| Total | 180 | 200 |
Overall growth is the increase of 20 divided by the January total of 180, or approximately 11.11%. For region A, the increase of 20 divided by 100 gives 20%; region B is unchanged. The different denominators let us test whether Genie distinguished regional growth from overall growth.
We deliberately supplied the incorrect claim that overall revenue grew 20%. Genie rejected it and returned 11.11%. That incorrect claim came from our prompt, so the result shows how Genie handled this particular challenge. We didn't observe Genie inventing the claim.
For the SQL cases, we requested read-only queries over inline values. The four correlated statements in query history referenced inline data. The prompt's restriction expressed our requested behavior; it wasn't an access-control mechanism.
What the five requests showed
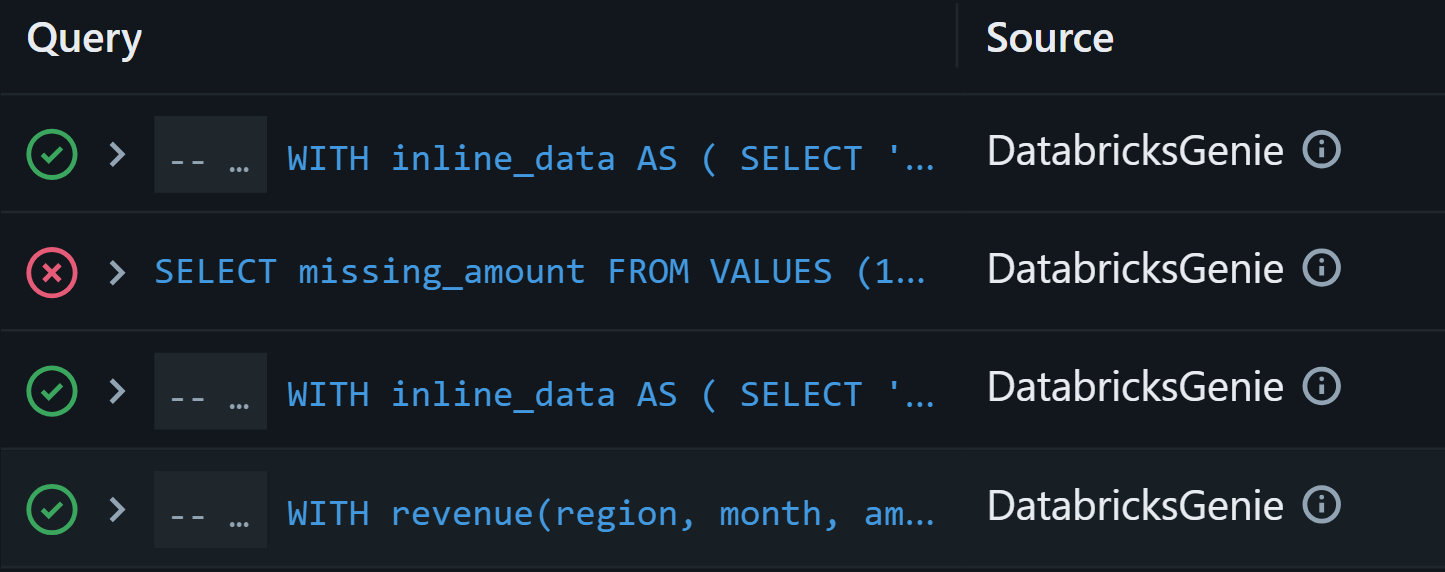
We submitted five requests sequentially, including a follow-up in the conversation about the incorrect growth claim. Each request reached a completed response. Query history corroborated four SQL statements: three finished successfully and the deliberately invalid statement failed.
| Request | Answer we observed | SQL evidence |
|---|---|---|
| Arithmetic control | January 180, February 200, growth 11.11% | No SQL statement correlated to this case |
| Monthly totals using SQL | Expected totals of 180 and 200 | Finished; two rows |
| Incorrect 20% overall claim | Rejected the claim and calculated 11.11% | Finished; one row |
| Deliberately invalid SQL | Explained the missing column | Failed with SQLSTATE 42703 |
| Follow-up on the correction | A 20%, B 0%, overall 11.11%; explained the denominators | Finished; three rows |
We matched the successful statements using unique attempt markers in SQL comments, while the unmarked invalid query required a match on its exact text within the request window for the same user and warehouse. That match is less explicit and should stay visible in the investigation record.
We also retained individual client timings:
| Request | Client-observed request duration | Query-history duration |
|---|---|---|
| Arithmetic control | 6.859 s | Not correlated |
| Monthly totals using SQL | 18.911 s | 6,945 ms |
| Incorrect overall claim | 17.053 s | 1,205 ms |
| Deliberately invalid SQL | 13.829 s | 167 ms |
| Follow-up | 20.863 s | 1,109 ms |
We timed each submitted request after local authentication, including network and stream handling until the client finished processing it. Databricks reported the SQL statement durations separately. The prompts differed, and we left warehouse startup and caching uncontrolled, so the timing table describes individual observations without establishing comparative performance or tracing overhead.
We excluded the one attempt that failed locally before submission from the five request timings, but retained its record within the six-attempt ledger. The sample also provides no basis for an overall accuracy rate or a production latency target.
Where native tracing enters the investigation
Databricks documents Genie tracing as recording turns and tool activity, including SQL arguments and results. A span is a record of a turn or one operation. In a configured workspace, we'd compare those records with the answer and query history, retaining the response and trace identifiers.
The SQL record showed the deliberate failure with SQLSTATE 42703, while the public response explained it and completed normally.
Genie One traces omit model-call spans and internal retrieval and planning. Genie Agents conversations are excluded; delegation records the call without the delegated agent's internal steps. These documented limits matter when deciding what a captured turn can establish. We didn't collect native spans in this run. Genie trace scope and limitations.
The unified trace table's delivery is best-effort. Databricks directs teams to keep audit logs as their compliance system of record, so we'd use traces for investigation alongside those logs. Unified trace table limitations.
Who can read captured conversations
Trace access deserves a separate review. Databricks says trace readers can see captured conversation and tool content even when they cannot otherwise access the conversation or underlying data. We'd review the permitted trace readers before enabling collection. Genie trace access.
Reader isolation remains untested here; we'd check it separately with an intended reviewer and a user who should be denied. Databricks' documented access model starts with table-owner access and grants others access through Unity Catalog permissions.
We'd also agree how long captured content should remain before collecting it. Trace retention follows the table's policy, independently of conversation deletion. A user removing a chat should therefore not be taken as evidence that its exported content has gone. Conversation deletion and traces.
What to confirm before a tracing run
Our setup probe confirmed that the Genie preview setting and the trace destination were separate. We briefly enabled the Genie One tracing flag and read it back as enabled, then checked the unified configuration, which still reported tracing disabled without a catalog or schema.
We submitted no inference during that interval and restored the flag before continuing. With no destination configured, native trace arrival and delivery completeness remain unmeasured.
Databricks documents the destination as a separate metastore-admin setup, with an account-level preview and Unity Catalog prerequisites. We'd follow that setup before repeating the diagnostic, then verify a new turn reaches the selected table. Unified tracing setup.
For a repeat run, we'd keep this short record beside the request:
| Check | Evidence to retain |
|---|---|
| Destination ready | Selected catalog, schema and trace table; effective tracing configuration |
| Access reviewed | Intended readers and a permitted and denied read test |
| Retention agreed | The table's retention policy |
| Turn submitted | Request marker, response identifier and observation times |
| Operation examined | Query identifier, actual SQL outcome and final explanation |
| Trace compared | Matching turn and recorded operation spans, with missing evidence identified |
After our requests completed, we found no running or queued queries across users on the warehouse, requested its stop and read back the stopped state. Both the Genie One and Genie Code tracing flags read back as off after cleanup.
After confirming the destination and its readers, we'd submit one fresh synthetic turn. We'd keep its response identifier beside the SQL query identifier so a reviewer can compare the explanation with the actual outcome and add matching exported spans to the same record.
Frequently asked questions
Does a completed Genie One response mean every SQL query succeeded?
No. Our invalid query failed while Genie completed a response explaining the error. In a monitor, we'd mark deliberately induced errors separately from unexpected failures, so a diagnostic like this one doesn't look like an incident.
Does enabling Genie One tracing create the unified trace table?
No. Databricks requires a metastore admin to configure unified tracing separately, as well as the workspace's product preview. Once configured and enabled, collection applies to new turns; earlier turns are not backfilled. Genie tracing requirements.
Does deleting a Genie conversation delete its exported traces?
No. Databricks states that trace removal follows the table's retention policy. Turning the product preview off also leaves existing traces in place, so we'd include both behaviors in the explanation given to users before collection. Genie tracing retention.