

This is the first part of a series about moving a B2B product's client reporting onto Databricks, one layer at a time. Each part covers one decision. The client requirement behind it, what we built, what we measured, and what we replaced. Nothing here is the final design.
Sooner or later a B2B product gets this ticket. Clients want their own analytics, inside the product, live, filterable, and it must not slow the application down. We got it with no data team and a database that was also the application's live store. This series is the answer we built on Databricks, including the steps we later threw away.
The ticket
The ticket was six lines:
- customizable without deployments
- dynamic query and filter options
- no impact on the application's performance
- no sync issues
- good charts and trends
- AI features
The client added a seventh in conversation, real-time numbers. They meant the row the application wrote a minute ago, on a chart, inside their portal, and a nightly refresh would not do. We built our first step around that one request.
"Real time" and "no impact on the application" cannot both be true on a live transactional database. We knew that going in. We did not know where the line would fall, and the one way to find out was to build the cheapest thing that shows the client real data and measure it.
Why Databricks
Why Databricks and not a BI tool on a read replica? Because of the sixth line. The client wants to grow in the AI and ML direction, and so do we. One governed place where the same tables serve dashboards today, natural-language questions tomorrow, and models after that sounded better than a BI stack now and a separate ML stack later.
Lakebase was the deciding factor. Databricks now has its own transactional database, a managed Postgres registered in the same Unity Catalog, with lakehouse tables synced into Postgres and, in preview, Postgres changes stored back as Delta. In that end state the application's own data lives on the same platform as its analytics, with one set of permissions and no copy jobs between systems. We are not there. It is the end state we chose, and the reason each step in this series stays on the platform, including the ones we rebuilt.
Step one: Lakehouse Federation
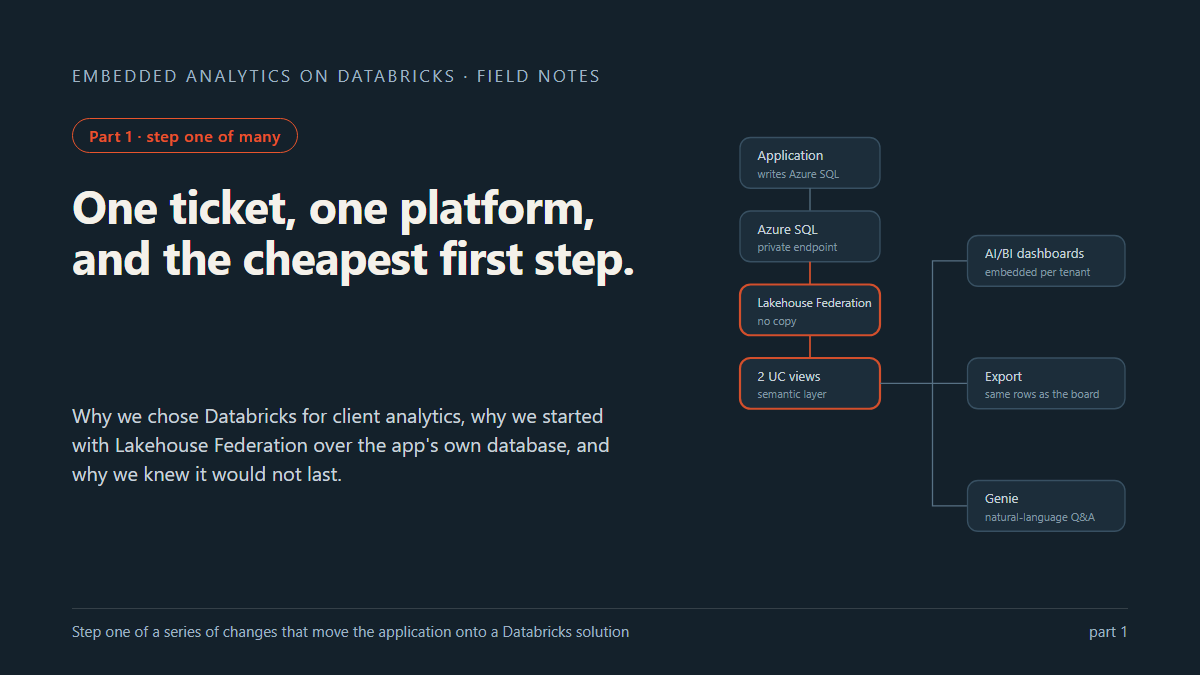
Step one was Lakehouse Federation over Azure SQL. One Connection, one foreign catalog, and the application's tables appear in Unity Catalog like any other. The workspace is serverless and reaches the database through the Azure-services firewall rule. Private connectivity is on the list for a later step. Credentials live in Key Vault, and a setup script loads them into the Unity Catalog connection, so nothing in code or in Terraform state holds them. There is no copy and no schedule. A dashboard reads the row the application wrote a moment ago, which is what the client asked for.
On top of the federated tables we put two Unity Catalog views that reproduce the old Power BI logic once. All five client reports read those two views, and the natural-language space lists them among its sources. Later steps moved the data to Delta snapshots, and we re-pointed the datasets at serving views of the same shape and left the widgets alone. In each step we swap one layer under the views and leave what sits above them untouched, and that let us start with the naive version.
What the pilot bought us, and what it cost
What the pilot bought us:
- a demo in front of the client within days
- real usage to measure instead of guesses
- no pipeline to build, no storage to pay for
What it cost us was the rest of this series.
Where federation fits:
- the source already has report-shaped views
- result sets stay small
- you need something live and governed within days
Where it does not fit is production scale. The main dev view holds under 2k rows. The table behind it holds 130k rows in test against 6.46 million in prod.
We treated it as scaffolding, and after the demo we could ask the client a better question than "real time". How fresh does it need to be, and for which numbers?
Next
Part 2: the query history from the first weeks, and how one dataset per widget made the database hate us.